Raspberry Pi Temperature Sensor
A few weeks ago, I purchased a Raspberry Pi. After reading Eben Upton's Book - Raspberry Pi User Guide, particularly the two chapters on which he focuses attention on the GPIO, I had an idea for my first project. The post covers the first iteration of a home temperature monitoring project I put together using a Raspberry Pi, a MCP9808 Temperature sensor, an old Mac Mini (early 2008), the InfluxDB time series database, Grafana time series visualization applcation, a bit of the Python programming language, and the runit init system.
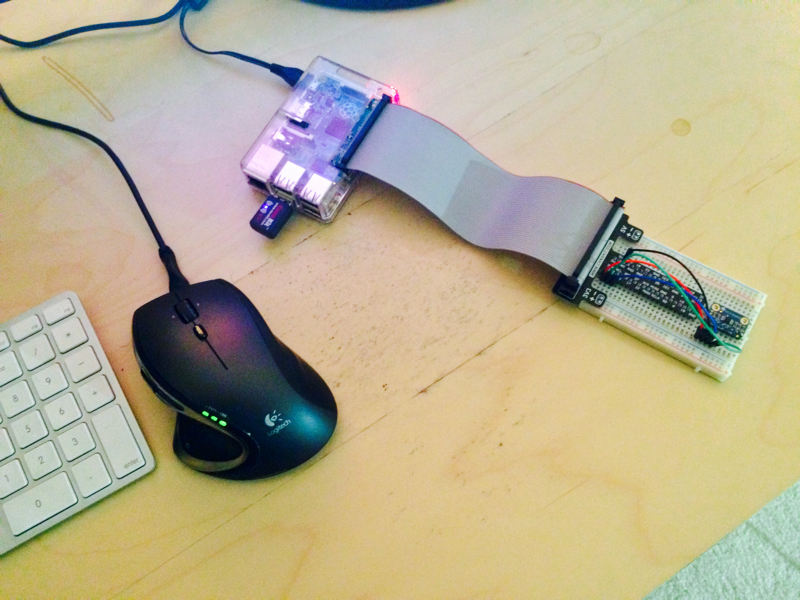
Figure 1: Raspberry Pi with MCP9808 temperature sensor
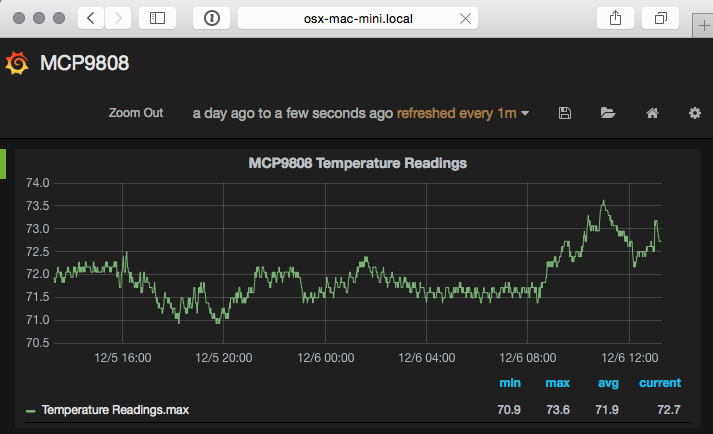
Figure 2: Grafana Dashboard with temperature data
The Sensor Hardware
For this project I chose to use the MCP9808 Breakout Board from Adafruit - an excellent online resource for electronics components, circuits, and ideas. I chose this unit for a few reasons:
- It's controlled over I²C -- Raspberry Pi's GPIO supports the require I²C bus over pins 3 (Serial Data Line, SDA) and 5 (Serial Clock Line, SCL)
- It runs in the 2.7V to 5.5V power and logic range -- the Raspberry Pi provides power lines at 3.3V and 5V
- It was pretty cheap (< $5 USD) -- My soldering skills are not the best.
Circuit Assembly
The MCP9808 Breakout Board ships from Adafruit mostly assembled. This particular kit requires only that you solder the included 8 pin header strip to the breakout board.
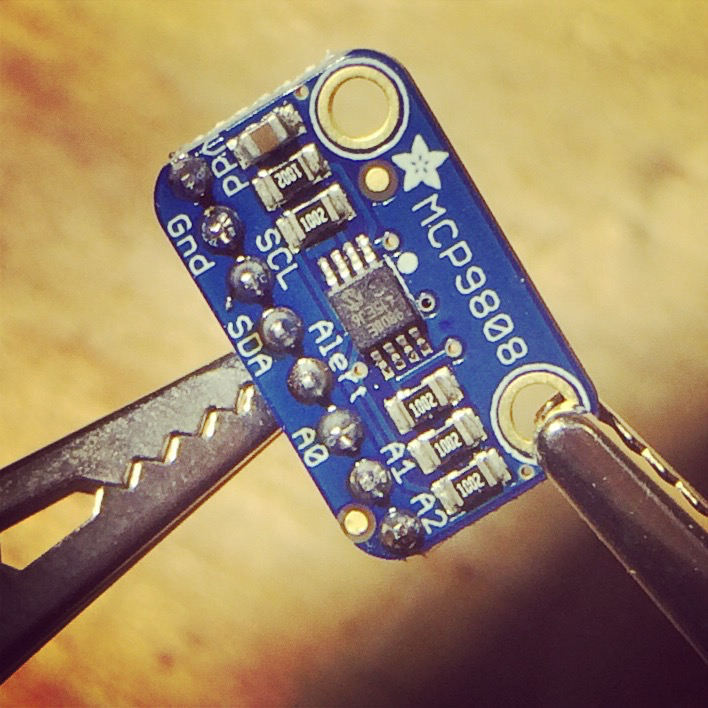
Figure 3: MCP9808 Sensor
I used a Raspberry PI "Cobbler" GPIO Breakout from CanaKit and a breadboard to connect the Raspberry Pi to the MCP9808; this approach is a bit easier to manage, correct wiring mistakes, and less permanent than soldering the sensor to the Raspberry Pi. To read temperatures from the MCP9808, only the power pin, ground, and the I²C SDA and SCL pins are required:
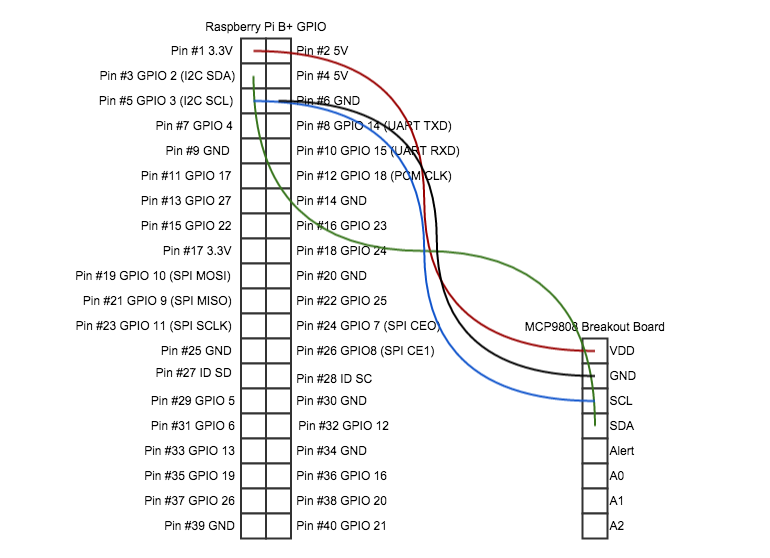
Figure 4: MCP9808 Wiring Diagram
| GPIO Pin # | GPIO Pin Name | MCP9808 Pin Name |
|---|---|---|
| 1 | 3.3V | VDD |
| 3 | SDA | SDA |
| 5 | SCL | SCL |
| 6 | GND | GND |
The remaining, optional, pins are not used in this project. They provide workarounds for I²C addressing issues when multiple devices are used on the same bus and a pin for alerting if the sensor reads a temperature above or below a threshold.
The Datastore
I knew that I wanted to back the project with a persistent datastore. This would allow me to capture data points and later analyze them for general trends, cross-reference heating/cooling patterns with weather events, etc.
I chose InfluxDB because of its time centric query language and storage model. I installed Influx on an old Mac Mini (Early 2009 with OSX 10.10) I had sitting under my desk. Getting a basic installation of InfluxDB up and running is well documented; since I already use Homebrew to manage most of my 3rd party dependencies and a formula for InfluxDB exists, installation was completed by issuing brew install influxdb.
Configure the InfluxDB database
With InfluxDB installed, I setup a database for storing my temperature readings and a database user to manage it. I used my InfluxDB instance's web console to do this; by default it runs on port 8083 of the InfluxDB host.
Create the new database; I named mine
mcp9808_test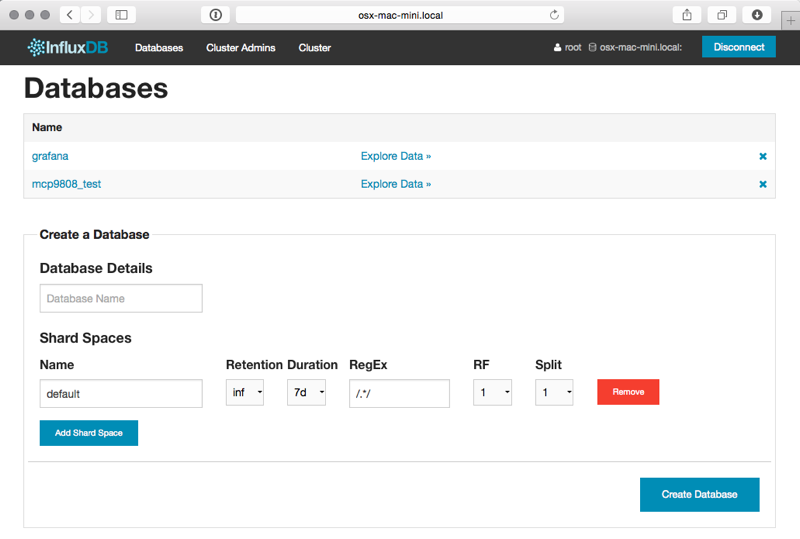
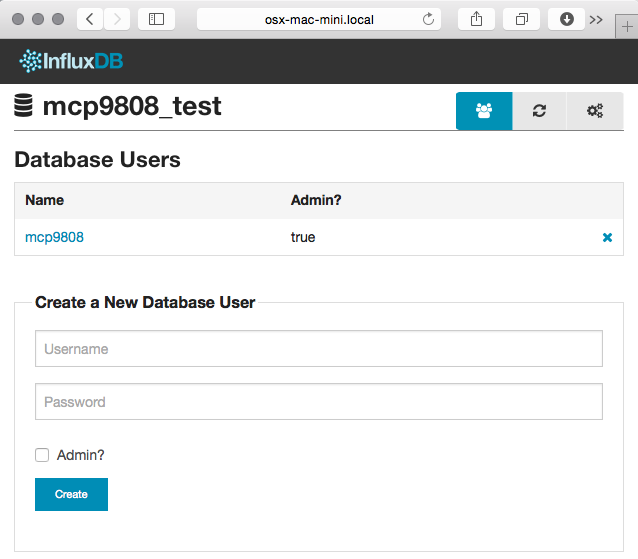
- Create the database admin user; I named mine
mcp9808- Click on the database name in the Databases list view
Create a New Database User
Raspberry Pi Configuration
Now that the hardware and datastore are setup, there's a bit of OS configuraiton needed to an out-of-the-box Raspberry Pi in order communicate with the MCP9808 over the I²C bus.
Enable I²C
By default, the Raspberry Pi does not load the required kernel modules to use the I²C bus. To enable I²C communication over the GPIO, I added the following two lines to /etc/modules
i2c-bcm2708
i2c-dev
Then reboot the Raspberry Pi
sudo reboot
After the system initalizses the system should be able to recognize the MCP9808 is connected. I used the i2cdetect cli tool to do so:
sudo i2cdetect 1 # channel 1 is the default on the Raspberry Pi B+ model
The Sensor Software
Adafruit provides a Python driver for interacting with the MCP9808 and a Python source code for interacting with the I²C interface of the Raspberry Pi. I made use of both of these in the main driver script for this project.
Install build dependencies
      sudo apt-get update
      sudo apt-get install build-essential python-dev python-smbus
Install the Adafruit_Python_MCP9808 wrapper
      cd ~/Downloads
      git clone https://github.com/adafruit/Adafruit_Python_MCP9808/blob/master/Adafruit_MCP9808
      cd Adafruit_MCP9808
      sudo python setup.py install
This will also install the I²C abstraction as the MCP9808 wrapper depends on it.
Read, Report, Repeat
Next I wrote a little python script, poll.py, to read from the MCP9808 on an interval and report its findings to the mcp9808_test InfluxDB database instance.
      #!/usr/bin/python
      import time
      import Adafruit_MCP9808.MCP9808 as MCP9808
      from influxdb import InfluxDBClient

      # Generates the necessary payload to post
      # temperature data into the InfluxDB
      def temperature_data(degrees_c):
        return [
            {
              'points': [[c_to_f(degrees_c)]],
              'name': 'Temperature Readings',
              'columns':['degrees_f']}]

      # Converts temperature representations in Centigrade
      # to Farenheight
      def c_to_f(c):
        return c * 9.0 / 5.0 + 32.0

      # Initializes comminication with the MCP9808
      # over the I2C bus.
      sensor = MCP9808.MCP9808()
      sensor.begin()

      # Defines the interval on which the capture logic
      # will occur
      capture_interval = 60.0 # Every 60 seconds

      # Establishes a connection to the mcp9808_test
      # InfluxDB instance
      influxClient = InfluxDBClient('<influx-db-host>', 8086, 'mcp9808', '<my_mcp9808_influxdb_user_password>', 'mcp9808_test')

      # Read, Report, Repeat
      while True:
        temp = sensor.readTempC()
        print "Temperature {0:0.3} F".format(c_to_f(temp))
        influxClient.write_points(temperature_data(temp))
        time.sleep(capture_interval)
Now it can be run using the following command; note that the script needs to be run as the root user of the Raspberry Pi in order to interact with the GPIO.
sudo python <path_to>/poll.py
For-ev-er
Horray! Everything was up and running... until I kicked the on/off switch of the powerstip under my desk. At this point I realized that I wanted to ensure that the poll.py script ran so long as the Raspberry Pi had power. To achieve this, I used the runit process supervisor.
Install runit
sudo apt-get runit
Initialize the
poll.pyProcess supervisorsudo mkdir -p /etc/sv/mcp9808_poll sudo mkdir -p /etc/sv/mcp9808_poll/log/main sudo touch /etc/sv/mcp9808_poll/run /etc/sv/mcp9808_poll/log/runEdit /etc/sv/mcp9808_poll/run and define the process
        #!/bin/sh
        exec 2>&1

        # Note that we intend runit to run as root
        # so we don't need to sudo here
        exec <path_to>/poll.py
Edit /etc/sv/mcp9808_poll/log/run
        #!/bin/bash
        exec svlogd -tt ./main
Now the polling process can be started and managed by runit by executing the following:
sudo sv start mcp9808_poll
ANALYZE ALL THE THINGS!
Sensor hardware, check! Datastore, check! Gluecode, check! Ok, cool; but now what?
InfluxDB Graphing
Well, now that the Raspberry Pi is reporting temperature readings every minute, it's time to start analyzing the data. As I mentioned before, I chose InfluxDB because of its ability to collate and aggregate time series data. For this project it makes sense to aggregate values of the degrees_f datapoints posted by the poll.py script for some given time interval.
For example, I like to look at the lowest recorded temperature readings for each hour over the course of a day. I might write a query to do this like so:
SELECT min(degrees_f) FROM "Temperature Readings" WHERE time > now() - 1d GROUP BY time(1h)
When a query is issued from the InfluxDB web console, the results are rendered in two formats. First, a graph of the data returned by the query is rendered; the X axis always represents time and Y axis the selected columns of the query. Second, InfluxDB renders a table of the datapoints matching the query and their timestamps.
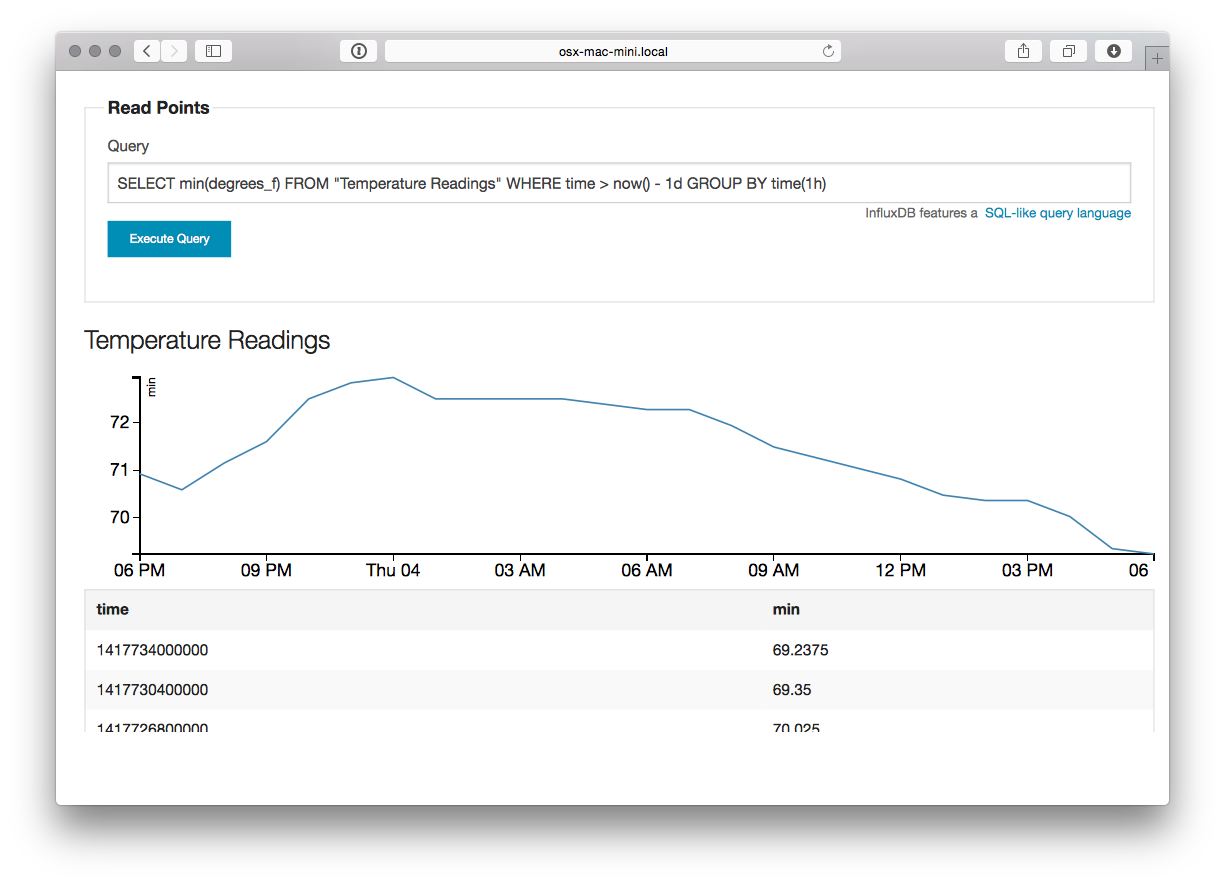
Figure 5: Influx Query - Select temperature readings for the 24 hours
This is really good for point analysis of things like high, low, and average temperatures for a given time interval, but it's an entirely manual process. What I really want is to see this data over a rolling time window; indefinitely. This is where Grafana comes into play.
Grafana
Grafana is a web applicaiton which provides metrics dashboards and graph editing. It can be configured, rather easily, to use InfluxDB as a metric source. It provides the ability to define queries against InfluxDB time series and plot the results, much like the InfluxDB web ui, but it also provides the ability to attach these graphs to dashboards and auto-refresh their content on a time interval.
Grafana is written, mostly, in javascript. As such, it only needs a webserver to host it. I chose to run the Nginx Webserver on the Mac Mini as well. Nginx is fairly easy to install an configure on Mac OSX with homebrew:
- Create a new InfluxDB called grafana to store dashboard configuration made through the UI
- Create a grafana user in this database
Install Nginx
brew install nginx ... ln -sfv /usr/local/opt/nginx/*.plist ~/Library/LaunchAgents launchctl load ~/Library/LaunchAgents/homebrew.mxcl.nginx.plist- Download the Grafana archive and uncompress the application source into Nginx's public directory
Copy the default grafana configuration
cp config.sample.js config.js
Edit
config.jsand tell grafana to use InfluxDB as its metric and dashboard datasource... return new Settings({ /* Data sources * ======================================================== * Datasources are used to fetch metrics, annotations, and serve as dashboard storage * - You can have multiple of the same type. * - grafanaDB: true marks it for use for dashboard storage * - default: true marks the datasource as the default metric source (if you have multiple) * - basic authentication: use url syntax http://username:password@domain:port */ // InfluxDB example setup (the InfluxDB databases specified need to exist) datasources: { influxdb: { type: 'influxdb', url: "http://<influxdb_host>:8086/db/mcp9808_test", username: 'mcp9808', password: '<mcp9808_user_password>' }, grafana: { type: 'influxdb', url: "http://<influx_dbhost>:8086/db/grafana", username: 'grafana', password: '<grafana_user_password>', grafanaDB: true }, ... });
Grafana is now available at http:/<nginx_host>/grafana
The last thing to do is define the grafana dashboard and use the datapoints from the Temperature Readings series of the InfluxDB.
- Add a new "graph" panel to the dashboard
Define the metric query and graph attributes
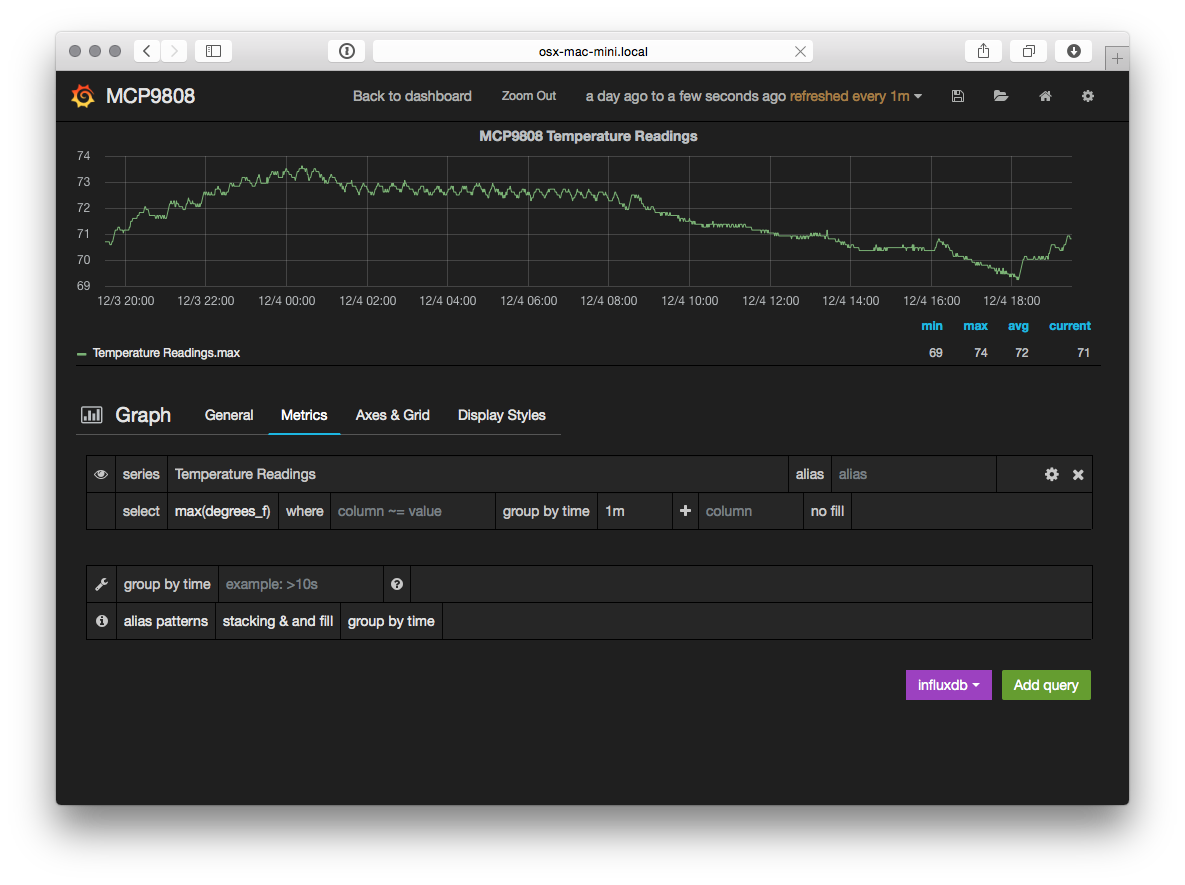
Figure 6: Grafana Metric Query
Return to the dashboard and select a time period against which the query should be run and an auto refresh interval
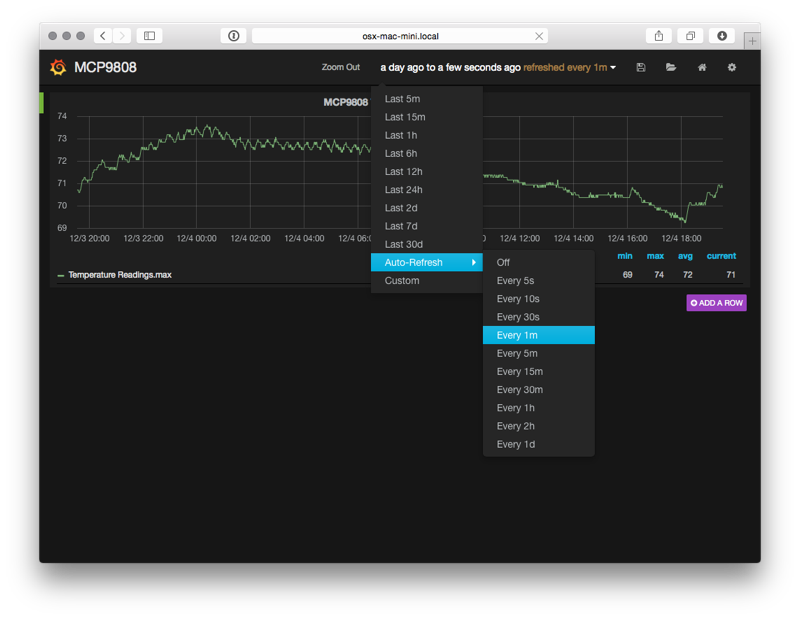
Figure 7: Grafana Dashboard
And voila! An view of the Temperature readings for the last day that updates every minute.
Conclusion
It's kind of hacky, but for about $50 USD and an afternoon of research, installation, configuration, and coding I have a very crude implementation of a digital thermometer and a way to collate historical temperature data about one particular area of my house. Future iterations of this project will most likely include cleanup and organization of the poll.py script, infrastructure and security enhancements (I'd really like to build a web application inbetween the poll.py script and the datastore to add notifications of temperature events, etc), and the addition of a few more sensors throughout the house.